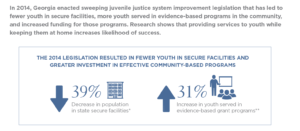
*Population data from FY2014-FY 2017 (year of reform to three years after)
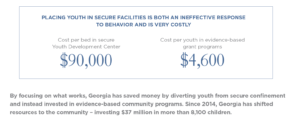
**Cost per youth based on grant amount allocated and number of youth served (note that some youth were served in multiple programs)
Download the infographic
Read more about juvenile justice improvements in Georgia